Ripe for Disruption? The Climate Story Behind Your Next Glass of Wine
My thesis project, Ripe for Disruption, is the final product from a 6-months long studio class, which is designed to build from scratch a complete data visualization project, before showcasing it as part of Parsons School's MS Data Visualization 2022 Keynotes (virtual symposium format).
Ideation, concept refinement, development, UI design, sketching/wireframing, data extraction & curation, technical execution and several rounds of (intense) collaborative iterations resulted in an dynamic data story that invites readers to explore the nexus between climate change and the wine industry.
Ideation, concept refinement, development, UI design, sketching/wireframing, data extraction & curation, technical execution and several rounds of (intense) collaborative iterations resulted in an dynamic data story that invites readers to explore the nexus between climate change and the wine industry.
Climate Change and the Wine Industry
Geovisualization & Storytelling
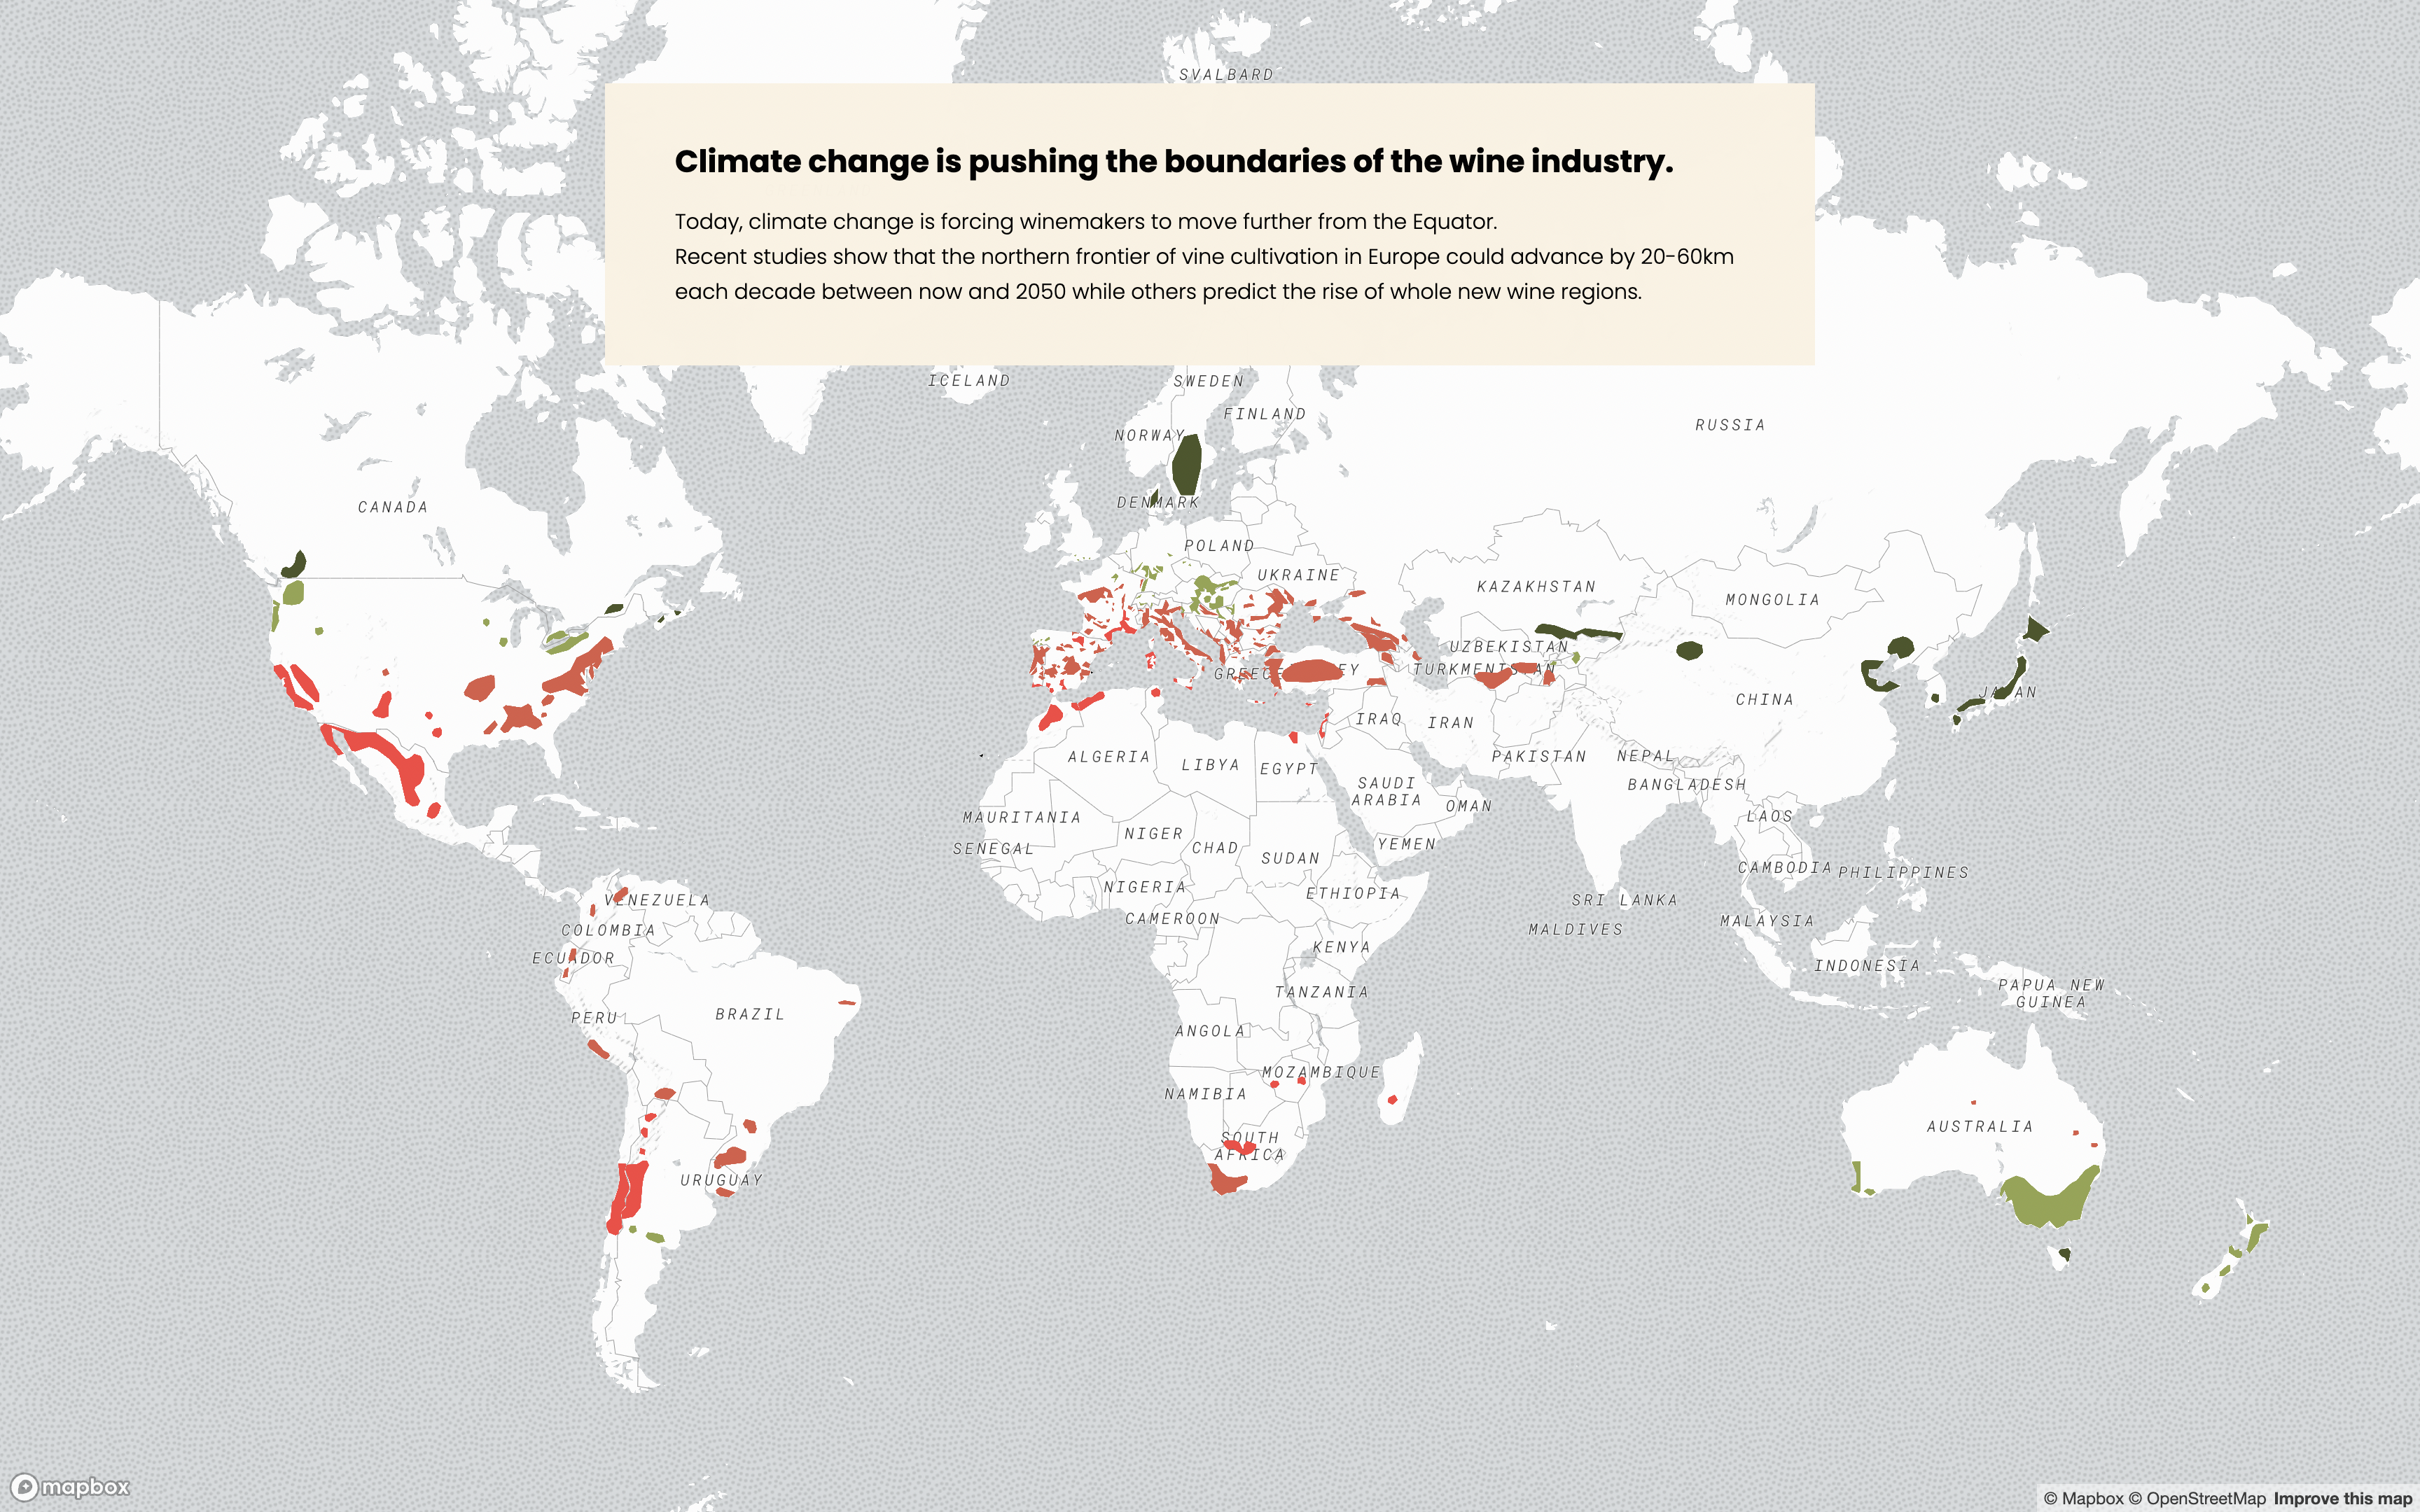
The project provides a “glocal” glimpse into the changing practices of the wine industry, by using geovisualization tools to help readers grasp which wine regions are already highly exposed to global warming.
A closer look at recent extreme weather events that impacted the “Old World” and the “New World” is provided to contextualize these significant shifts, before, exploring emerging opportunities as well as adaptive changes the wine industry might go through as a result.
Tools & Datasets
- HTML, CSS, Javascript (+jQuery)
- Sketching, Prototyping & Illustrations via Adobe Creative Cloud + Figma
- QGIS & Mapbox - including Scrollytelling
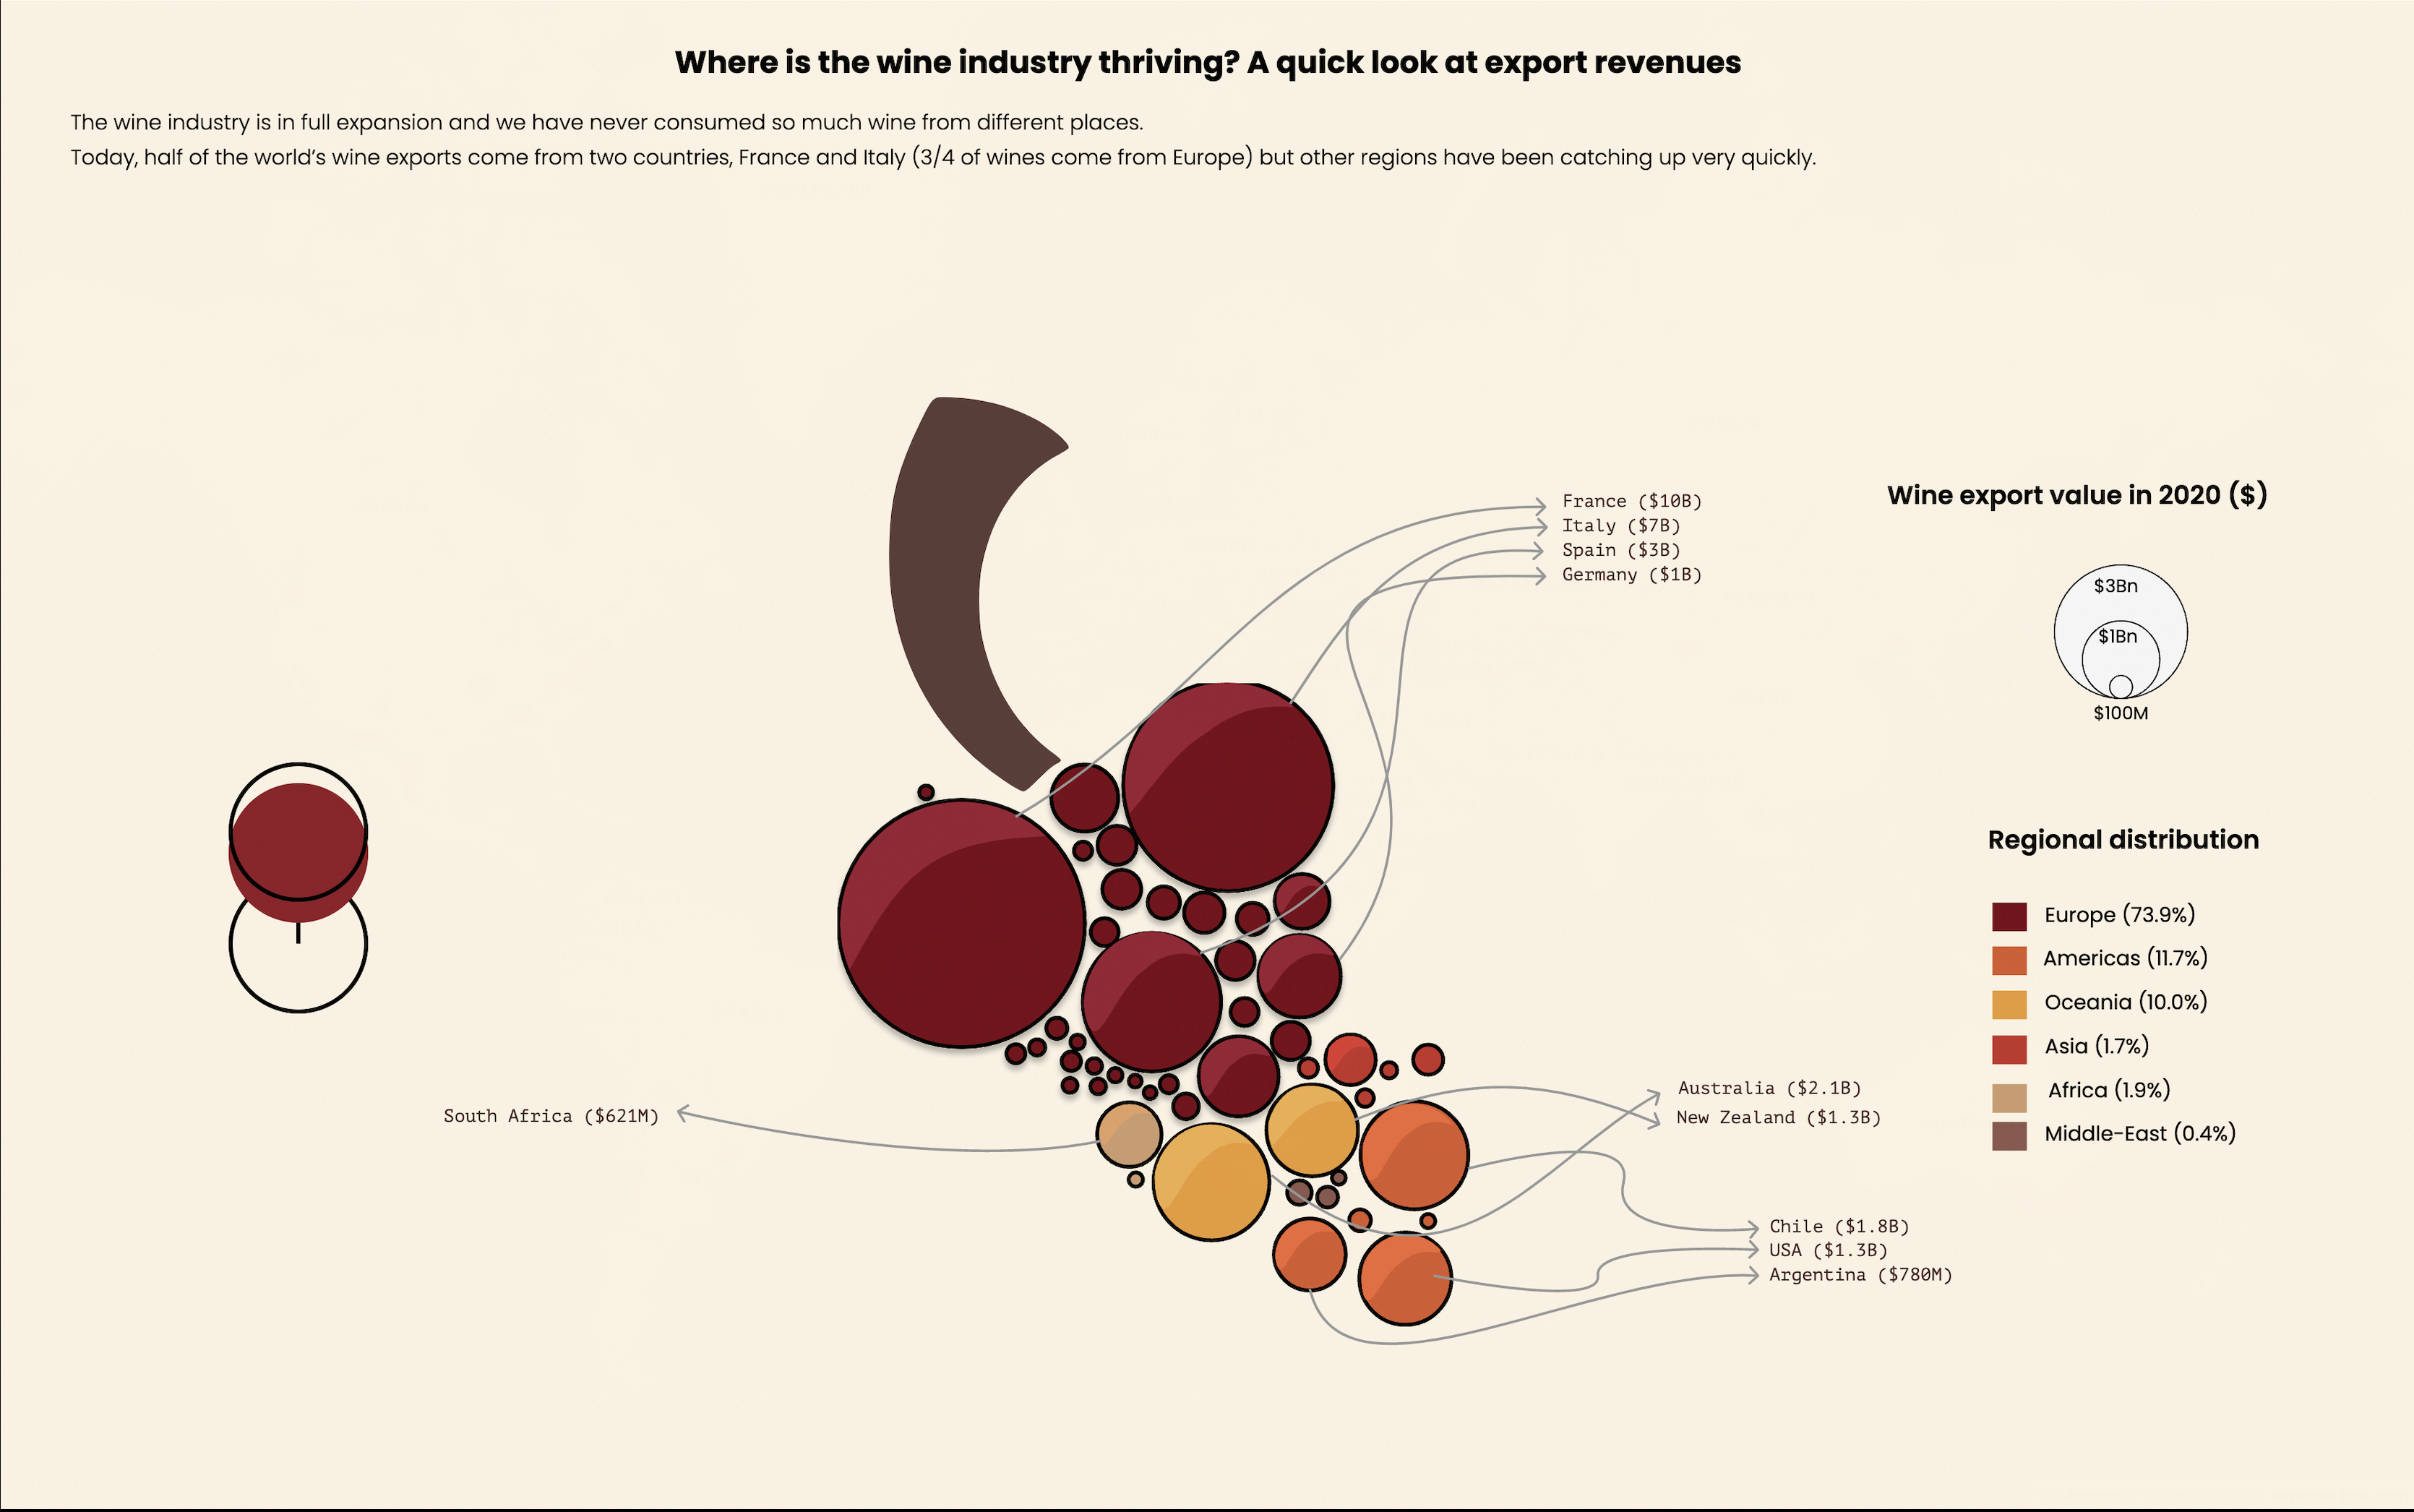
- Charts & Graphs:
- Data Sources:
- Shapefiles:
Images obtained via Unsplash, thematic content and data were curated and compiled through desktop research.